1. Bullish engulfing pattern:
the first candle is a black body with low volume and the second candle is a white body with high volume totally engulfing the first candle.
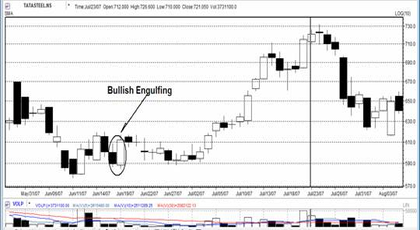
Example: I have identified the formation of bullish engulfing pattern formation in the price time chart of Tatasteel in June 18th, 2007and June 19th, 2007. Explain the breakout, target and the trend.
| Date |
Open |
High |
Low |
Close |
Total Trd Qty |
| 01-Jun-07 |
1364 |
1385 |
1356 |
1378.9 |
1908666 |
| 04-Jun-07 |
1400 |
1418.4 |
1390 |
1406.4 |
2182423 |
| 05-Jun-07 |
1400 |
1444.85 |
1393 |
1436.5 |
1808672 |
| 06-Jun-07 |
1445 |
1454 |
1381 |
1389.5 |
1857287 |
| 07-Jun-07 |
1382 |
1401.9 |
1353.25 |
1360.65 |
2148431 |
| 08-Jun-07 |
1331.3 |
1387 |
1321.3 |
1356.6 |
2037482 |
Analysis:
Bullish engulf find pattern form in a down trend. The price trend of Tatasteel was down in the previous time period. above the OHLC data is given for reference.
From the above OHLC data if you observe on 19th June 2007 the high is higher than the 18th June 2007 high and 19th June 2007 low is lower than the 18th June 2007 low and the 19th June 2007 closing is higher than the opening which forms a white candle and confirms the formation bullish engulfing pattern.
Pattern breakout: on 19th June 2007 the high to low price range is 617-585=32 price units. The 78.6% (i.e. the Fibonacci retracement ratio) of the price range is 25. The pattern breaks out will happen at a price of 617 +25= 642. As long as the price maintain below this price one can assume that that the throwaway can happen at any stage.
| Date |
Open |
High |
Low |
Close |
Total Trd Qty |
| 01-Jun-07 |
1364 |
1385 |
1356 |
1378.9 |
1908666 |
| 04-Jun-07 |
1400 |
1418.4 |
1390 |
1406.4 |
2182423 |
| 05-Jun-07 |
1400 |
1444.85 |
1393 |
1436.5 |
1808672 |
| 06-Jun-07 |
1445 |
1454 |
1381 |
1389.5 |
1857287 |
| 07-Jun-07 |
1382 |
1401.9 |
1353.25 |
1360.65 |
2148431 |
| 08-Jun-07 |
1331.3 |
1387 |
1321.3 |
1356.6 |
2037482 |
Analysis:
Bullish engulf find pattern form in a down trend. The price trend of Tatasteel was down in the previous time period. above the OHLC data is given for reference.
From the above OHLC data if you observe on 19th June 2007 the high is higher than the 18th June 2007 high and 19th June 2007 low is lower than the 18th June 2007 low and the 19th June 2007 closing is higher than the opening which forms a white candle and confirms the formation bullish engulfing pattern.
Pattern breakout: On 19th June 2007 the high to low price range is 617-585=32 price units. The 78.6% (i.e. the Fibonacci retracement ratio) of the price range is 25. The pattern breaks out will happen at a price of 617 +25= 642. As long as the price maintain below this price one can assume that that the throwaway can happen at any stage.
Target: Engulfing pattern target is unlimited until and unless the price does not form any bearish reversal candle pattern in the chart. In more than 50% cases the throw away happens before giving a break out in this pattern.
Volume: Volume used to be moderate in the engulfing day. Sudden rise in volume you can observe in the pattern break out day.
Pattern failure: If the price moves below 585-25 = 560 then we say that the bullish engulfing pattern is a failure.
What will be entry and exit point?
The entry is suggested at a price above the engulfing days high having stop loss below the pattern failure price point. The target is unlimited until and unless any bearish formation does not takes place. It is also advisable to make an entry in the counter after the pattern breakout happens.
In the above example the pattern failure does not happen but throwaway happens multiple times before giving a breakout on 14th July 2007.In this context the bullish trend reversal pattern means the trend is going to change from bearish to bullish. Bearish trend reversal pattern means the trend is going to change from bullish to bearish.
2. Bearish engulfing pattern:
“the first candle is a white body with low volume and the second candle is a black body with high volume totally engulf the first body”

This is also a common pattern in price time chart and strongest bearish reversal pattern. The success rate of this pattern formation is more than 80 %( i.e. in more than 80% cases the pattern use to give break out). Once the pattern is identified the next job is to find out the break out point, throwaway price, entry and exit point, pattern failure price point and target.
In all candles stick reversal patterns the price target is unlimited until and unless any contradictory reversal pattern is not formed in the price time chart in the breakout direction.
Example:
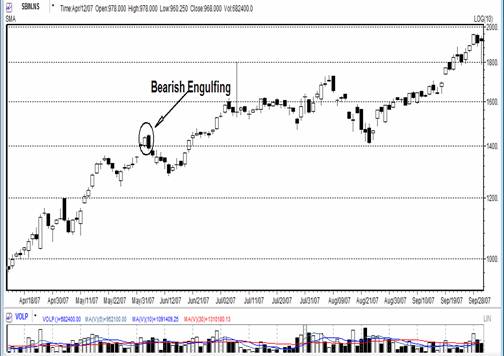
I have identified the formation of bearish engulfing pattern in SBI on 06th June 2007. Find out the break out point, target, pattern failure point, entry and exit point? Below the price time chart and the OHLC data is given for reference.
| Date |
Open |
High |
Low |
Close |
Total Trd Qty |
| 01-Jun-07 |
1364 |
1385 |
1356 |
1378.9 |
1908666 |
| 04-Jun-07 |
1400 |
1418.4 |
1390 |
1406.4 |
2182423 |
| 05-Jun-07 |
1400 |
1444.85 |
1393 |
1436.5 |
1808672 |
| 06-Jun-07 |
1445 |
1454 |
1381 |
1389.5 |
1857287 |
| 07-Jun-07 |
1382 |
1401.9 |
1353.25 |
1360.65 |
2148431 |
| 08-Jun-07 |
1331.3 |
1387 |
1321.3 |
1356.6 |
2037482 |
Analysis:
Bearish engulfing pattern forms in a bull trend and indicates reversal of the bull trend. From the OHLC data it is being observed that the 6th June 2007 high is higher than the 5th June 2007 high, the 6th June 2007 low is lower than the 5th June 2007 low. The closing of the 6th June 2007 is lower than the opening. Hence it confirms the formation of bearish engulfing pattern.
Pattern break out: on 6th June 2007 the high to low price range is 1454-1381=73. The 78.6% (i.e. the Fibonacci retracement ratio) of the price range is 57.37. The pattern break out will happen at a price of 1381 – 57.37= 1323.63 . As long as the price maintains above this level one can assume that the throwaway can happen at any stage.
Target: Engulfing pattern target is unlimited until and unless the price does not form any bullish reversal candle pattern in the chart. In more than 50% cases the throwaway happens before giving a break out in this pattern.
Volume: Volume use to be moderate in the engulfing day. Sudden rise in volume you can observe in the pattern break out day.
Pattern failure: if the price moves above 1454+57.37 = 1511.37 then we say the bearish engulfing pattern is a failure.
What will be entry and exit point?
It is advisable to enter a short trade on the day following the engulfing day with a price above the break out point having stop loss at the pattern failure price point. The target will be unlimited until and unless it has not formed any contradictory reversal pattern. It is also advisable to make an entry after you encounter a break has happened for better result. In our case the pattern has failed to give a break out and became a failure in the future days.