| | | | | |
Day trade using elliot wave
Introduction:
After extensive research on the Elliot wave theory with an objective to simplify it to an maximum extend so that it can be understood by the trader community I have come across with many issues and some simple and gentle solution. I have developed one calculator based on those achievements however this tool only attends the limited logical part of the wave theory.The wave approach of analyzing the price of stock, index or commodity starts with the cycle. This debated word “cycle” means the occurrences of similar kind of trend in future. In wave approach the cycle is again simplified by the way of classifying it in time frames. For example the grand super cycle is the name given to a trend which happened or reoccurs once in a decade.
Answer is simple. Say the average lifespan or life cycle of human is 70 years. This means the older generation dies or disappears in every 70 years and new generation having the similar behavior, life style, habits fill that gap. Many such examples we are experiencing on cycle every day in our life. Hence I can conclude with at present what ever we are experiencing in nature was being experienced by our ancestors some time in past. This may be the literary definition of cycle and sounds much philosophical.The 2nd principle followed by wave principle is "Every price action in a cycle is harmonic in nature". Based on these two principles Elliot gave a set of rules and guideline for constructing the price waves in a harmonic cycle. The price trends never follow all the guidelines given by Elliot. However it follows all the rules. The price and time action rules to form a wave pattern are derived from the Fibonacci ratio. Totally 8 different waves are being classified grouped into two categories
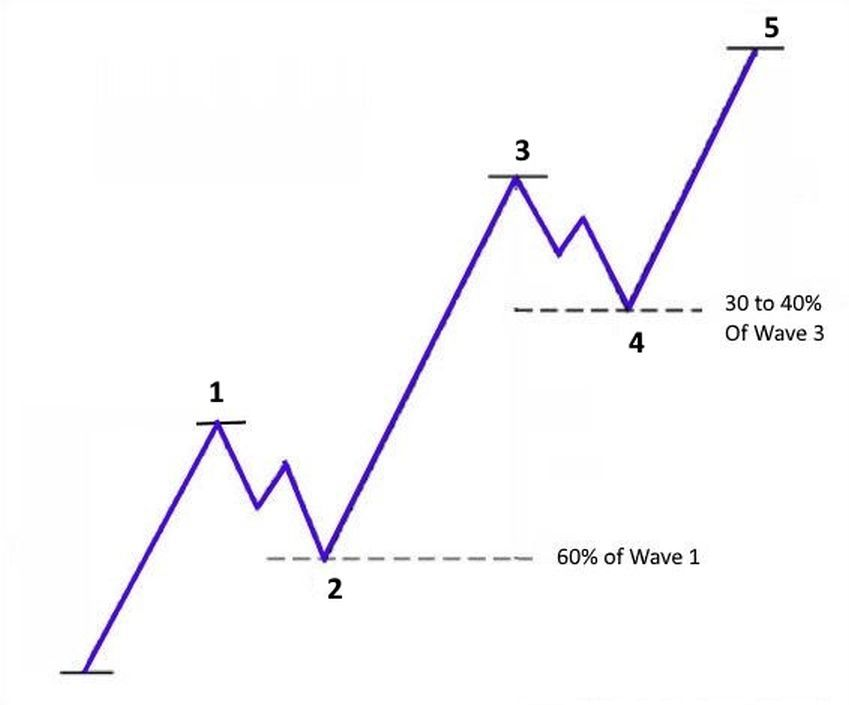
In this 5th category waves are placed and named as 1-2-3-4-5 .
In this 3rd category waves are placed and named as A-B-C .
The confirmation or completion of wave 2 and wave B are used by the traders to take a long and short position in a particular counter. However during the process of this journey of completing the “Impulsive harmonic cyclic” pattern the wave pattern meet with many guide line or rule violations.
These action of violation is called wave failures.
Many times you would have heard from the analysts that fifth wave failure happened in so and so counter. Some time some waves used to stretch beyond its permissible guideline parameter. This phenomenon is calls wave expansion . In order to give you some experience in wave principle of trading. we have devised one simple calculator for you. which is available on our calculator section. Two different approach is being followed by the analysts to forecast the trend as per the wave principle.
Under this approach the analyst devise the long term cycle to smaller cycles.Then each wave in the long term cycle is studied and different wave patterns are placed within it.After which an wave count report is produced which includes each primary waves sub wave,sub wave patterns,number of failure waves,consequence of these failure waves. Based on this data the future long term cycle is placed and trend parameter was get set. This process require in depth understanding of the wave principle and quite difficult to do manually. Though now a days many software's are available to help you in this.
Under this approach you need to construct the wave’s construction start and end points manually based on the wave rules for a prior trend. After which you need to find the failed waves or expanded waves. After this process you can forecast the trend passed on your past experience of wave construction. Do remember in this process you are not investigating the sub waves or the wave within a wave or smaller cycle wave inside the big cycle wave. However in the wave counting approach all those things are attended carefully. Also read the elliot wave calculator manual for extened set of example and explanation. Our Elliot wave calculator will help you in deriving some finest trade decision but it will not guide you in learning.
If you are a beginner then you must have to learn the wave rules and cycle rules. After which you need to under stand the 13 different wave patterns. This will completing your 1st step of learning. Then you need to study the price patterns applying the 2nd approach discussed by me . After gaining the gradual experience you can migrate to the wave count approach. you can complete your learning within few months with the help of software. But it is not impossible to master this technique without the help of software. I have published the complete wave rule and patterns on my book on Technical Analysis volume -3.you may find many more on web too.