
Must Read ArticleA.Day Trading Made EasyB.Wise Stock Investment Tricks C.F&O Trade TechniquesD.Currency Trading TechniquesE.Commodity Trading TechniquesF.Understand the EconomeyDay Trading Made EasyA.Learn intraday tradingB.Day trade using gann methodC.Day trade using fibonacci methodD.Day trade using elliot waveE.Day trade using technicalF.Introduction to decoupling methodDay Trading Made EasyA.My experiment on gann methodB.My experiment on fibonacci methodC.When to do day trade ?D.Why to use our intrday calculator ?E.Why to take our intraday call servise ?F.Best trade plan to win intraday trade ?
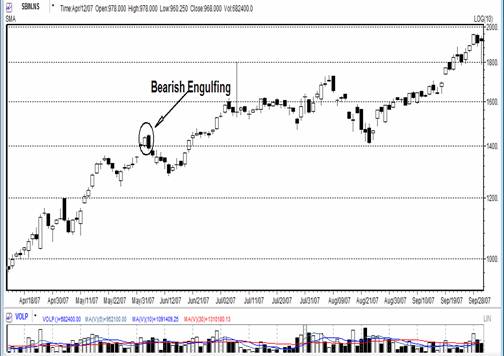
This is also a common pattern in price time chart and strongest bearish reversal pattern. The success rate of this pattern formation is more than 80 %( i.e. in more than 80% cases the pattern use to give break out). Once the pattern is identified the next job is to find out the break out point, throwaway price, entry and exit point, pattern failure price point and target.
In all candles stick reversal patterns the price target is unlimited until and unless any contradictory reversal pattern is not formed in the price time chart in the breakout direction.
Example: I have identified the formation of bearish engulfing pattern in SBI on 06th June 2007. Find out the break out point, target, pattern failure point, entry and exit point? Below the price time chart and the OHLC data is given for reference.
 Continue
Continue